Multiple Choice
Figure 9.8 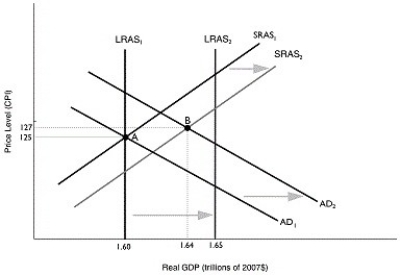 Alt text for Figure 9.8: In figure 9.8, a graph comparing real GDP and price level.
Long description for Figure 9.8: The x-axis is labelled, real GDP (trillions of dollars) , with values 1.60, 1.64, 1.65 marked.The y-axis is labelled, price level (CPI) , with values 125 and 127 marked.6 lines are shown; SRAS1, SRAS2, AD1, AD2, LRAS1, LRAS2.Line SRAS1 begins in the bottom left corner and slopes up to the top right corner.Line SRAS2 follows the same slope as line SRAS1, but is plotted to the right.The area between lines SRAS1 and SRAS2 is indicated by a right pointing arrow.Line AD1 begins at the top left corner and slopes down to the bottom center.Line AD2 follows the same slope as line AD1, but is plotted to the right.The area between lines AD1 and AD2 is indicated by a right pointing arrow.Line LRAS1 is perpendicular to the x-axis, and begins from the value 1.60.Line LRAS2 is perpendicular to the x-axis, and begins from the value 1.65.The area between lines LRAS1 and LRAS2 is indicated by a right pointing arrow.Line LRAS1 intersects lines AD1 and SRAS1 at point A (1.60, 125) .Lines AD2 and SRAS2 intersect at point B (1.64, 127) .Points A and B are connected to their respective coordinates on the x-axis and y-axis with dotted lines.Line LRAS2 intersects lines SRAS1 and SRAS2 near the right end of these lines.Similarly, line LRAS2 intersects lines AD1 and AD2 near the right end of these lines.
-Refer to Figure 9.8.Given the economy is at point A in year 1, the unemployment rate will ________ and the price level will ________ in year 2.
A) rise; rise
B) rise; fall
C) fall; rise
D) fall; fall
Correct Answer:

Verified
Correct Answer:
Verified
Q4: Which aggregate supply curve has a positive
Q7: A decrease in disposable income will shift
Q31: The process of an economy adjusting from
Q34: Potential GDP is also referred to as<br>A)realized
Q35: If rapid increases in oil prices caused
Q40: All of the following would be considered
Q84: When the price of oil rises unexpectedly,the
Q119: Using an aggregate demand graph,illustrate the impact
Q136: Explain the three reasons the aggregate demand
Q206: What are sticky prices,and how can contracts