Multiple Choice
Figure 11.7 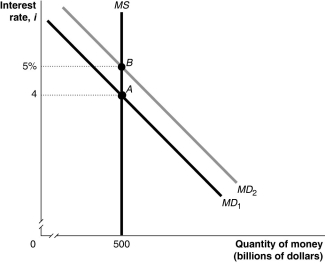 Alt text for Figure 11.7: In figure 11.7, a graph shows movement in the money market.
Long description for Figure 11.7: The x-axis is labelled, quantity of money, M (billions of dollars) , with value 500 marked.The y-axis is labelled, interest rate, i, with values 4 and 5% marked.3 lines are shown; MD1, MD2, and MS.Line MD1 begins in the top left corner and slopes down to the end of the x-axis.Line MD2 follows the same slope as line MD1, but is plotted to the right.Line MS is perpendicular to the x-axis, and begins from the value 500.Line MD1 meets line MS at point A (500, 4) , a little more than half way along both lines.Line MD2 meets line MS at point B (500, 5%) , approximately 3 quarters of the way along both lines.These points of intersection are connected to their respective coordinates on the y-axis using dotted lines.
-Refer to Figure 11.7.In the figure above, the movement from point A to point B in the money market would be caused by
A) an increase in the price level.
B) a decrease in real GDP.
C) an open market sale of Canada bonds by the Bank of Canada.
D) an increase in the desired reserve ratio by commercial banks.
E) the Bank of Canada making more loans to commercial banks.
Correct Answer:

Verified
Correct Answer:
Verified
Q36: Changes in interest rates affect all four
Q87: A borrower defaults on a loan when
Q120: The situation in which short-term interest rates
Q122: Using the money demand and money supply
Q124: Which of the following correctly describes a
Q127: The leader of the monetarist school and
Q128: Suppose the Bank of Canada increases the
Q129: Increases in the price level<br>A)increase the opportunity
Q130: Table 11.7 <img src="https://d2lvgg3v3hfg70.cloudfront.net/TB3061/.jpg" alt="Table 11.7
Q161: Use a graph to show the effects