Multiple Choice
Figure 11.9 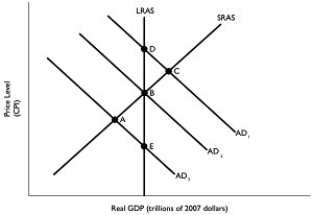 Alt text for Figure 11.9: In figure 11.9, a static AD-AS model.
Long description for Figure 11.9: The x-axis is labelled, real GDP (trillions of 2007 dollars) and the y-axis is labelled, price level (CPI) .5 lines are shown; AD1, AD2, AD3, LRAS, SRAS.Line AD1 begins in the top left corner and slopes down to the end of the x-axis.Line AD2 follows the same slope but is plotted to the left.Similarly, line AD3 is plotted to the left of line AD2.Line SRAS begins close to the vertex and slopes up to the top right corner.Line LRAS is perpendicular to the x-axis, and passes through points D, B, and E.Lines AD3 and SRAS intersect at point A.Lines AD2, LRAS, and SRAS intersect at point B.Lines AD1 and SRAS intersect at point C.Lines AD1 and LRAS intersect at point D.Lines AD3 and LRAS intersect at point E.
-Refer to Figure 11.9.Suppose the Bank of Canada sells government of Canada bonds in pursuit of contractionary monetary policy.Using the static AD-AS model in the figure above, this situation would be depicted as a movement from
A) A to B.
B) B to D.
C) C to B.
D) B to C.
E) C to D.
Correct Answer:

Verified
Correct Answer:
Verified
Q59: The Bank of Canada focuses on which
Q60: The Taylor rule puts more emphasis on
Q62: Use the money demand and money supply
Q63: If the Bank of Canada lowers its
Q65: Using the money demand and money supply
Q66: In the countries that have adopted inflation
Q67: What actions should the Bank of Canada
Q68: The money demand curve, against possible levels
Q69: Write out the expression for the Taylor
Q170: A decrease in interest rates can _