Multiple Choice
Figure 11.16 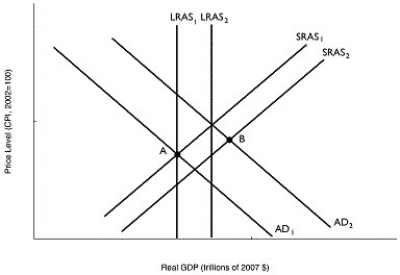 Alt text for Figure 11.16: In figure 11.16, a graph comparing real GDP and price level.
Long description for Figure 11.16: The x-axis is labelled, real GDP (trillions of 2007 dollars) .The y-axis is labelled, price level (CPI, 2002 = 100) .6 lines are shown; SRAS1, SRAS2, AD1, AD2, LRAS1, and LRAS2.Line SRAS1 begins near the bottom left corner and slopes up to the top right corner.Line SRAS2 follows the same slope as line SRAS1, but is plotted to the right.Line AD1 begins at the top left corner and slopes down to the end of the x-axis.Line AD2 follows the same slope as line AD1, but is plotted to the right.Lines LRAS1 and LRAS2 are perpendicular to the x-axis, such that line LRAS2 is to the right of line LRAS1.Line LRAS1 intersects the lines AD1 and SRAS1 at point A.Lines AD2 and SRAS2 intersect at point B.
-Refer to Figure 11.16.In the figure above, if the economy in Year 1 is at point A and is expected in Year 2 to be at point B, then the appropriate monetary policy by the Bank of Canada would be to
A) purchase Canada bonds.
B) sell Canada bonds.
C) lower income taxes.
D) raise reserve requirements.
E) extend more loans to commercial banks.
Correct Answer:

Verified
Correct Answer:
Verified
Q47: The Bank of Canada has adopted an
Q48: The turmoil in financial markets that began
Q49: When housing prices fall, as they do
Q50: The ability of the Bank of Canada
Q51: Why doesn't the Bank of Canada have
Q53: Your roommate is having trouble grasping how
Q54: The monetary policy target the Bank of
Q55: The Bank of Canada promptly cut the
Q56: The Bank of Canada's two main _
Q57: If the Bank of Canada raises or