Multiple Choice
Figure 12.3 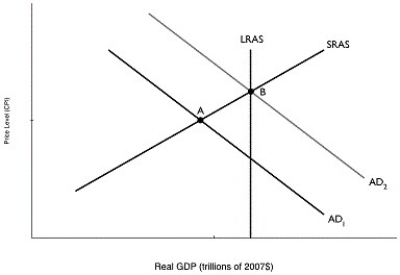 Alt text for Figure 12.3: In figure 12.3, a graph comparing real GDP and price level.
Long description for Figure 12.3: The x-axis is labelled, real GDP (trillions of 2007 dollars) and the y-axis is labelled, price level (CPI) .4 lines are shown; AD1, AD2, LRAS, and SRAS.Line AD1 begins at the top left corner and slopes down to the end of the x-axis.Line AD2 follows the same slope as line AD1, but is plotted to the right.Line SRAS begins close to the vertex and slopes up to the top right corner.Line LRAS is perpendicular to the x-axis and passes through point B.Lines AD1 and SRAS intersect at point A.Lines AD2, LRAS, and SRAS intersect at point B.
-Refer to Figure 12.3.In the graph above, suppose the economy is initially at point A.The movement of the economy to point B as shown in the graph illustrates the effect of which of the following policy actions by the federal government?
A) a decrease in income taxes
B) a decrease in interest rates
C) a decrease in government purchases
D) an increase in the money supply
E) an increase in the number of national statutory holidays
Correct Answer:

Verified
Correct Answer:
Verified
Q40: Which of the following is an example
Q43: The tax multiplier<br>A)is negative.<br>B)is larger in absolute
Q44: Government spending on health care will likely<br>A)decrease
Q46: During recessions, government expenditure automatically<br>A)falls because of
Q49: List the major categories of federal government
Q129: What is the "tax wedge"?
Q169: The government purchases multiplier will be larger
Q205: What are the key differences between how
Q216: Included in government expenditures are government purchases
Q301: The double taxation problem occurs because households