Multiple Choice
Figure 12.5 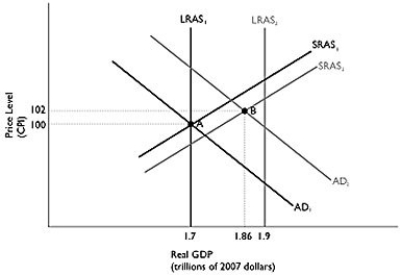 Alt text for Figure 12.5: In figure 12.5, a dynamic model of AD-AS.
Long description for Figure 12.5: The x-axis is labelled, real GDP (trillions of 2007 dollars) .The y-axis is labelled, price level (CPI) .6 lines are shown; SRAS1, SRAS2, AD1, AD2, LRAS1, and LRAS2.Line SRAS1 begins in the bottom left corner and slopes up to the top right corner.Line SRAS2 follows the same slope as line SRAS1, but is plotted to the right.Line AD1 begins at the top left corner and slopes down to the bottom center.Line AD2 follows the same slope as line AD1, but is plotted to the right.Line LRAS1 is perpendicular to the x-axis, and begins from the x-axis value 1.7.Line LRAS2 is perpendicular to the x-axis, and begins from x-axis value 1.9.Line LRAS1 intersects lines AD1 and SRAS1 at point A (1.7, 100) .Lines AD2 and SRAS2 intersect at point B (1.86, 102) .Points A and B are connected to their respective coordinates on the x and y-axes with dotted lines.Line LRAS2 intersects the lines SRAS1 and SRAS2 near the top end of these lines.Line LRAS2 intersects the lines AD1 and AD2 near the bottom end of these lines.
-Refer to Figure 12.5.In the dynamic model of AD-AS in the figure above, if the economy is at point A in year 1 and is expected to go to point B in year 2, the federal government would most likely
A) decrease government spending.
B) increase government spending.
C) increase oil prices.
D) increase taxes.
E) lower interest rates.
Correct Answer:

Verified
Correct Answer:
Verified
Q34: What impact would you expect an increase
Q35: Which of the following is a reason
Q36: Suppose the federal budget deficit for the
Q37: Assume a closed economy, that taxes are
Q39: Which of the following is not an
Q40: Which of the following is an example
Q43: The tax multiplier<br>A)is negative.<br>B)is larger in absolute
Q87: It is _ difficult to effectively time
Q205: What are the key differences between how
Q301: The double taxation problem occurs because households