Multiple Choice
Figure 13.2 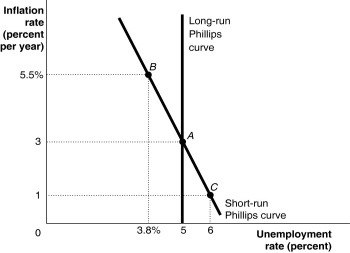 Alt text for Figure 13.2: In figure 13.2, a graph shows the short-run and long-run Phillips curves.
Long description for Figure 13.2: The x-axis is labelled, unemployment rate (percent) .The y-axis is labelled, inflation rate (percent per year) .3 points; A (5, 3) , B (3.8%, 5.5%) , C (6, 1) are plotted on the graph.The points are connected to their respective coordinates on the x and y-axes with dotted lines.A straight line labelled, short-run Philips Curve, begins at the top left corner and slopes down to the bottom center, and passes through points A, B, and C.A straight line labelled, long-run Philips Curve, is perpendicular to the x-axis, begins from the x-axis value 5,and intersects the Short-run Philips Curve at point A.
-Refer to Figure 13.2.Suppose the economy is at point C.If the Bank of Canada decreases the money supply so that inflation falls, the economy will ________ in the long run, holding all else constant.
A) eventually move to point A
B) eventually move to point B
C) stay at point C
D) move to point A and then back to point B
Correct Answer:

Verified
Correct Answer:
Verified
Q38: Use the information below to explain adjustments
Q93: The major criticism of real business cycle
Q94: An increase in the expected inflation rate
Q95: If expected inflation rises, the long-run Phillips
Q96: Figure 13.1 <img src="https://d2lvgg3v3hfg70.cloudfront.net/TB3061/.jpg" alt="Figure 13.1
Q98: In the aftermath of the global recession,
Q99: Monetary policy has _ impact on the
Q100: When reducing the overnight rate was no
Q102: Many central banks around the world are
Q147: If the rate of inflation in the