Multiple Choice
Figure 13.2 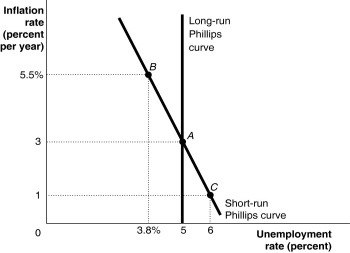 Alt text for Figure 13.2: In figure 13.2, a graph shows the short-run and long-run Phillips curves.
Long description for Figure 13.2: The x-axis is labelled, unemployment rate (percent) .The y-axis is labelled, inflation rate (percent per year) .3 points; A (5, 3) , B (3.8%, 5.5%) , C (6, 1) are plotted on the graph.The points are connected to their respective coordinates on the x and y-axes with dotted lines.A straight line labelled, short-run Philips Curve, begins at the top left corner and slopes down to the bottom center, and passes through points A, B, and C.A straight line labelled, long-run Philips Curve, is perpendicular to the x-axis, begins from the x-axis value 5,and intersects the Short-run Philips Curve at point A.
-Refer to Figure 13.2.Suppose the economy is at point A.The Bank of Canada uses expansionary monetary policy to lower the unemployment rate permanently below the level associated with A.Which of the following will occur?
A) Inflation will accelerate in the long run.
B) Inflationary expectations will decline.
C) Unemployment will rise above the natural rate.
D) Unemployment will accelerate in the long run.
E) Inflation will be permanently lower in the long run.
Correct Answer:

Verified
Correct Answer:
Verified
Q46: If workers and firms raise their inflation
Q47: The short-run Phillips curve shifting down following
Q48: In the long run, the Phillips curve
Q49: The curve showing the short-run relationship between
Q50: Figure 13.1 <img src="https://d2lvgg3v3hfg70.cloudfront.net/TB3061/.jpg" alt="Figure 13.1
Q53: The Bank of Canada's inflation targeting policy
Q55: In which of the following situations might
Q93: One problem with deflation is that it
Q172: According to the short-run Phillips curve,the unemployment
Q184: A study conducted by Robert Shiller,a Yale