Multiple Choice
Figure 13.6 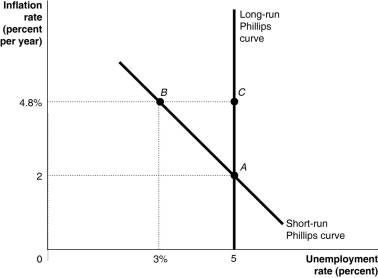 Alt text for Figure 13.6: In figure 13.6, a graph shows the short-run and long-run Phillips curves.
Long description for Figure 13.6: The x-axis is labelled, unemployment rate percent.The y-axis is labelled, inflation rate percent per year.A straight line labelled, short-run Philips Curve, begins at the top left corner and slopes down to the end of the x-axis.A straight line labelled, long-run Philips Curve is perpendicular to the x-axis, and begins from the x-axis value 5.Long-run Philips Curve intersects the short-run Philips Curve at point A (5, 2) , near the bottom of the line and passes through point C (5, 4.8%) near the top end.Point B (3%, 4.8%) is plotted near the left end of the short-run Philips Curve, with the same y-axis value as point C.The points are connected to their respective coordinates on the x and y-axes with dotted lines.
-Refer to Figure 13.6.If firms and workers have rational expectations, an expansionary monetary policy will cause the short-run equilibrium to move from
A) point B to point C.
B) point C to point A.
C) point A to point B.
D) point B to point A.
E) point A to point C.
Correct Answer:

Verified
Correct Answer:
Verified
Q67: Evidence shows that many people who delay
Q68: Canadians have loaded up on debt to
Q69: Employees at the university have negotiated a
Q70: What actions could the Bank of Canada
Q71: What impact does expansionary monetary policy have
Q74: If actual inflation is greater than expected
Q76: What can the Bank of Canada do
Q77: The price level in the economy between
Q192: If the actual rate of inflation exceeds
Q231: If unemployment persists for a long period