Multiple Choice
Figure 13.7 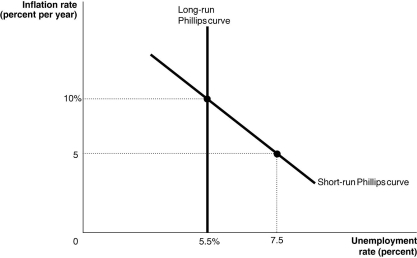 Alt text for Figure 13.7: In figure 13.7, a graph shows the short-run and long-run Phillips curves.
Long description for Figure 13.7: The x-axis is labelled, unemployment rate percent.The y-axis is labelled, inflation rate percent per year.A line labelled, short-run Philips Curve, begins at the top left corner and slopes down to the end of the x-axis.A line labelled, long-run Philips Curve, is perpendicular to the x-axis, and begins at the x-axis value 5.5%.Long-run Philips curve intersects short-run Philips Curve, at point (5.5%, 10%) just past the midpoint of both lines.Point (7.5, 5) is plotted close to the right end of the short-run Philips Curve.The points are connected to their respective coordinates on the x and y-axes with dotted lines.
-Refer to Figure 13.7.Consider the Phillips curves depicted in the graph above.The Bank of Canada announces its intention to decrease inflation from 10 percent to 5 percent per year, and it succeeds. If expectations of inflation are not altered by the Bank of Canada's announcement, the rate of unemployment will be ________ in the short run.
A) less than 5.5 percent
B) 5.5 percent
C) between 5.5 and 7.5 percent
D) 7.5 percent
Correct Answer:

Verified
Correct Answer:
Verified
Q56: An increase in frictional unemployment will<br>A)shift the
Q74: If actual inflation is greater than expected
Q76: What can the Bank of Canada do
Q77: The price level in the economy between
Q78: In conducting monetary policy, how has the
Q80: If workers and firms expect that inflation
Q81: Figure 13.3 <img src="https://d2lvgg3v3hfg70.cloudfront.net/TB3061/.jpg" alt="Figure 13.3
Q82: Assume the unemployment rate is currently at
Q84: According to _, the economy is normally
Q192: If the actual rate of inflation exceeds