Multiple Choice
Figure 13.10 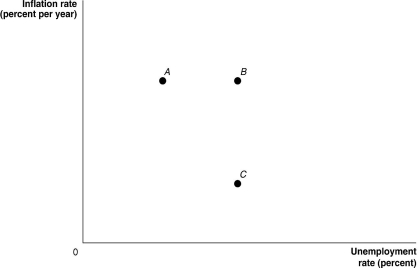 Alt text for Figure 13.10: In figure 13.10, a graph shows the points along which a typical long-run Phillips curve runs.
Long description for Figure 13.10: The x-axis is labelled, unemployment rate percent, and the y-axis is labelled, inflation rate percent per year.3 points; A, B, and C are plotted such that A and B share equivalent y-axis values, and B and C share equivalent x-axis values.
-Refer to Figure 13.10.A typical long-run Phillips curve would have the appearance of a curve running through points
A) A and B.
B) A and C.
C) B and C.
D) A, B, and C.
Correct Answer:

Verified
Correct Answer:
Verified
Q1: When unemployment is below its natural rate,
Q2: Monetary policy can<br>A)shift the short-run trade-off between
Q3: If actual inflation is less than expected
Q5: If the Bank of Canada attempts to
Q6: When inflation is very low, how do
Q7: If the long-run aggregate supply curve is
Q8: Figure 13.1 <img src="https://d2lvgg3v3hfg70.cloudfront.net/TB3061/.jpg" alt="Figure 13.1
Q9: In face of a negative supply shock,
Q10: In 2017 the small country of Notrealia
Q11: A decrease in aggregate demand will<br>A)cause inflation.<br>B)decrease