Multiple Choice
Figure 13.11 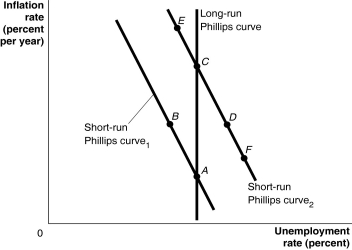 Alt text for Figure 13.11: In figure 13.11, a graph of the Phillips curve.
Long description for Figure 13.11: The x-axis is labelled, unemployment rate percent, and the y-axis is labelled, inflation rate percent per year.A straight line labelled, short-run Philips Curve 1, begins at the top left corner and slopes down to the bottom center.A straight line labelled, short-run Philips Curve 2, follows the same slope as Curve 1, but is plotted to the right.A straight line labelled, long-run Philips Curve, is perpendicular to the x-axis, and intersects the short-run Philips Curve 1, at point A on the bottom end of both lines.Point B is plotted half way along the short-run Philips Curve 1.Long-run Philips Curve, intersects the short-run Philips Curve 2, at point C in the top half of both lines.Point D is plotted more than half-way along short-run Philips Curve 2.Points E and F are plotted close to the left and right ends, respectively, of the short-run Philips Curve 2.
-Refer to Figure 13.11.A supply shock, such as rising oil prices, would be depicted as a movement from ________.
A) A to D to C
B) C to B to A
C) C to D to A
D) C to E to B
E) A to B to C
Correct Answer:

Verified
Correct Answer:
Verified
Q37: Deflation refers to<br>A)a decrease in the rate
Q38: Suppose a candidate for Prime Minister makes
Q39: Lucas and Sargent argue that the short-run
Q40: Which of the following is not an
Q41: Figure 13.1 <img src="https://d2lvgg3v3hfg70.cloudfront.net/TB3061/.jpg" alt="Figure 13.1
Q43: If the Bank of Canada chooses to
Q46: If workers and firms raise their inflation
Q47: The short-run Phillips curve shifting down following
Q101: What does it mean to say that
Q140: When will an increase in aggregate demand