Multiple Choice
Figure 13.10 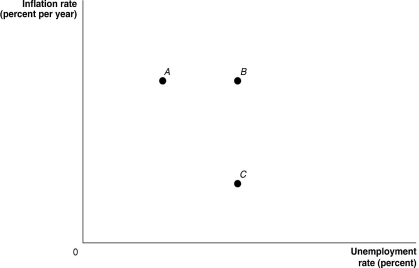 Alt text for Figure 13.10: In figure 13.10, a graph comparing unemployment rate and inflation rate.
Long description for Figure 13.10: The x-axis is labelled, unemployment rate percent, and the y-axis is labelled, inflation rate percent per year.3 points; A, B, and C are plotted such that A and B share equivalent y-axis values, and B and C share equivalent x-axis values.
-Refer to Figure 13.10.A response to persistent ________ due to ongoing expansionary monetary policy is depicted in the figure above as a movement from C to A to B.
A) deflation
B) high unemployment
C) high inflation
D) appreciation of the dollar
E) falling expectations of inflation
Correct Answer:

Verified
Correct Answer:
Verified
Q53: The Bank of Canada's inflation targeting policy
Q55: In which of the following situations might
Q57: Can the Bank of Canada achieve both
Q59: Figure 13.2 <img src="https://d2lvgg3v3hfg70.cloudfront.net/TB3061/.jpg" alt="Figure 13.2
Q62: If the Bank of Canada attempts to
Q63: The increases in oil prices in 1974
Q93: One problem with deflation is that it
Q184: A study conducted by Robert Shiller,a Yale
Q189: If actual inflation is greater than expected
Q202: According to the "rational expectations" school of