Multiple Choice
Figure 14.1 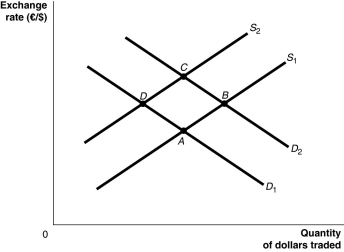 Alt text for Figure 14.1: In figure 14.1, a graph illustrates the quantity of dollars traded against the exchange rate.
Long description for Figure 14.1: The x-axis is labelled, quantity of dollars traded, and the y-axis is labelled, exchange rate, euros against dollars.2 supply curves; S1 and S2, and two demand curves; D1 and D2 are plotted.Supply curve S1 is a straight line which slopes up from the bottom left corner to the top left corner, and passes through points A and B.Supply curve S2 is a straight line with the same slope as S1, but plotted above.S2 passes through points D and C.Demand curve D1 is a straight line, which slopes down from the top left corner to the bottom right corner.Curve D1 intersects curve S1 at point A, and curve S2 at point D.Demand curve D2 is a straight line with the same slope as D1, but plotted above.Curve D2 intersects curve S1 at point B, and curve S2 at point C.
-Refer to Figure 14.1.The French fall in love with British Columbian wines and triple their purchases of this beverage.Assuming all else remains constant, this would be represented as a movement from
A) B to A.
B) C to D.
C) B to C.
D) A to D.
E) A to B.
Correct Answer:

Verified
Correct Answer:
Verified
Q47: The relative price of a country's goods
Q51: What are the three main sets of
Q157: Which of the following would increase the
Q158: All else equal, a depreciation of the
Q160: If the exchange rate changes from $2.00
Q162: An increase in federal government budget deficits
Q163: Based on the following information, what is
Q164: Figure 14.1 <img src="https://d2lvgg3v3hfg70.cloudfront.net/TB3061/.jpg" alt="Figure 14.1
Q165: You're travelling in Japan and are thinking
Q166: The level of saving in Canada has