Multiple Choice
Figure 14.1 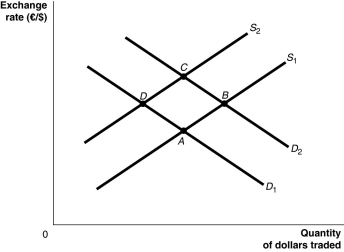 Alt text for Figure 14.1: In figure 14.1, a graph illustrates the quantity of dollars traded against the exchange rate.
Long description for Figure 14.1: The x-axis is labelled, quantity of dollars traded, and the y-axis is labelled, exchange rate, euros against dollars.2 supply curves; S1 and S2, and two demand curves; D1 and D2 are plotted.Supply curve S1 is a straight line which slopes up from the bottom left corner to the top left corner, and passes through points A and B.Supply curve S2 is a straight line with the same slope as S1, but plotted above.S2 passes through points D and C.Demand curve D1 is a straight line, which slopes down from the top left corner to the bottom right corner.Curve D1 intersects curve S1 at point A, and curve S2 at point D.Demand curve D2 is a straight line with the same slope as D1, but plotted above.Curve D2 intersects curve S1 at point B, and curve S2 at point C.
-Refer to Figure 14.1.Suppose that Canadian government deficits cause interest rates in Canada to rise relative to those in the European Union.Assuming all else remains constant, how would this be represented?
A) Supply would decrease, demand would decrease and the economy moves from B to C to D.
B) Supply would increase, demand would decrease and the economy moves from C to B to A.
C) Supply would decrease, demand would increase and the economy moves from A to D to C.
D) Supply would increase, demand would increase and the economy moves from D to A to B.
Correct Answer:

Verified
Correct Answer:
Verified
Q235: In 2016 Venezuela was expected to experience
Q236: If Canada has a current account deficit
Q237: A decrease in the demand for Canadian-made
Q238: Suppose the federal government is successful in
Q239: When exchange rates are not determined in
Q241: If the price level in Canada is
Q242: Which of the following equations is true
Q243: The Japanese recession of 2007-2009 decreased the
Q244: Which of the following would cause the
Q245: When net capital flows are positive,<br>A)capital inflows