Multiple Choice
Figure 14.2 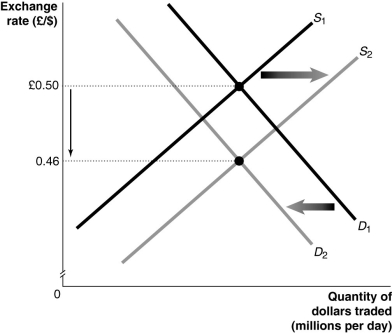 Alt text for Figure 14.2: In figure 14.2, a graph illustrates the quantity of dollars traded against the exchange rate.
Long description for Figure 14.2: The x-axis is labelled, quantity of dollars traded in millions per day, and the y-axis is labelled, exchange rate, British pound against Canadian dollars, with points 0.46 and British pound 0.50 marked.2 straight line supply curves, S1 and S2, slope up from the bottom left corner to the top right corner.Curve S2 is plotted to the right of curve S1.Demand curves D1 and D2 are straight line curves which slope down from the top left corner to the bottom left corner, with curve D2 plotted to the left of curve D1.Curves S1 and S2 intersect demand curves D1 and D2.The intersection point of curves S1 and D1 is connected to its corresponding y-axis value of British pound 0.50 with a dotted line.The intersection point of curves S2 and D2 is connected to its corresponding y-axis value of 0.46 with a dotted line.The intersection point of curves S1 and D1 is connected to its corresponding y-axis value of British pound 0.50 with a dotted line.A down pointing arrow indicates the difference between these values on the y-axis.arrow is shown between the 2 dotted lines.A right pointing arrow indicates the change from curve S1 to curve S2, and a left pointing arrow indicates the change from curve D1 to curve D2.
-Refer to Figure 14.2.Which of the events below would cause the shifts in the supply and demand curves in the market for Canadian dollars against the British pound shown in the graph above?
A) Interest rates rise in England.
B) Interest rates rise in Canada.
C) Real income rises in Canada.
D) Real income falls in England.
E) The imposition of a tariff on English goods by Canada.
Correct Answer:

Verified
Correct Answer:
Verified
Q37: Suppose that domestic investment in Japan is
Q38: When Canada sends money to Haiti to
Q40: Assuming no change in the nominal exchange
Q41: If there is currently a surplus of
Q43: In an open economy, expansionary monetary policy
Q44: Assuming Canada is the "domestic" country, if
Q45: The balance of trade is defined as<br>A)the
Q46: If net exports are negative,<br>A)net foreign investment
Q47: An expansionary monetary policy in Canada should<br>A)decrease
Q63: Explain how "net capital flows" are related