Multiple Choice
Figure 14.4 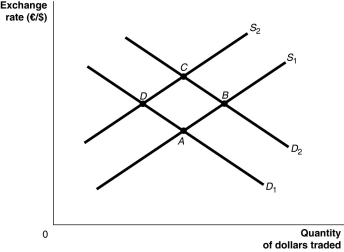 Alt text for Figure 14.4: In figure 14.4, a graph illustrates the quantity of dollars traded against the exchange rate.
Long description for Figure 14.4: The x-axis is labelled, quantity of dollars traded, and the y-axis is labelled, exchange rate, euros against dollars.2 supply curves; S1 and S2, and 2 demand curves; D1 and D2 are plotted.Supply curve S1 is a straight line which slopes up from the bottom left corner to the top right corner.It passes through points A and B.Supply curve S2 is a straight line with the same slope as curve S1, but is plotted to the right.Curve S2 passes through points D and C.Demand curve D1 is a straight line which slopes down from the top left corner to the bottom right corner.Curve D1 intersects curve S1 at point A, and curve S2 at point D.Demand curve D2 has the same slope as curve D1, but is plotted to the right Curve D2 intersects curve S1 at point B, and curve S2 at point C.
-Refer to Figure 14.4.The depreciation of the euro is represented as a movement from
A) D to A.
B) C to D.
C) B to C.
D) B to A.
Correct Answer:

Verified
Correct Answer:
Verified
Q169: All else equal, a depreciation of the
Q170: How will an interest rate decrease in
Q171: If national saving decreases,<br>A)the sum of domestic
Q172: If the Bank of Canada pursues an
Q173: Which of the following will shift the
Q175: A decrease in capital outflows from Canada
Q176: A Canadian hospital hires radiology services from
Q177: If the dollar appreciates, how will aggregate
Q178: Ceteris paribus, a rise in interest rates
Q179: Based in the United States, IBM is