Multiple Choice
Figure 14.4 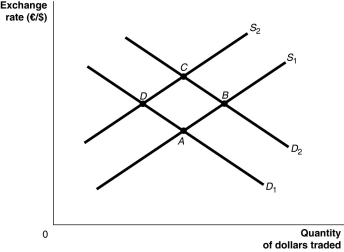 Alt text for Figure 14.4: In figure 14.4, a graph illustrates the quantity of dollars traded against the exchange rate.
Long description for Figure 14.4: The x-axis is labelled, quantity of dollars traded, and the y-axis is labelled, exchange rate, euros against dollars.2 supply curves; S1 and S2, and 2 demand curves; D1 and D2 are plotted.Supply curve S1 is a straight line which slopes up from the bottom left corner to the top right corner.It passes through points A and B.Supply curve S2 is a straight line with the same slope as curve S1, but is plotted to the right.Curve S2 passes through points D and C.Demand curve D1 is a straight line which slopes down from the top left corner to the bottom right corner.Curve D1 intersects curve S1 at point A, and curve S2 at point D.Demand curve D2 has the same slope as curve D1, but is plotted to the right Curve D2 intersects curve S1 at point B, and curve S2 at point C.
-Refer to Figure 14.4.Europe experiences an economic boom.Assuming all else remains constant, this would be represented as a movement from
A) D to A.
B) D to C.
C) C to B.
D) B to A.
Correct Answer:

Verified
Correct Answer:
Verified
Q16: Figure 14.4 <img src="https://d2lvgg3v3hfg70.cloudfront.net/TB3061/.jpg" alt="Figure 14.4
Q18: If the nominal exchange rate between the
Q20: When the market value of the dollar
Q22: Figure 14.1 <img src="https://d2lvgg3v3hfg70.cloudfront.net/TB3061/.jpg" alt="Figure 14.1
Q23: If we take into account transfer payments
Q24: Table 14.2 <img src="https://d2lvgg3v3hfg70.cloudfront.net/TB3061/.jpg" alt="Table 14.2
Q26: An open economy is an economy that
Q75: Which of the following is "crowded out"
Q161: Monetary policy has a greater impact in
Q270: The large budget deficits of the early