Multiple Choice
Figure 15.8 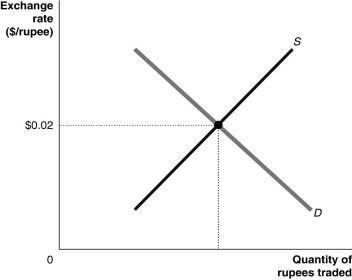 Alt text for Figure 15.8: In figure 15.8, a graph illustrates the quantity of rupees traded against the exchange rate.
Long description for Figure 15.8: The x-axis is labelled, quantity of rupees traded.The y-axis is labelled exchange rate, Canadian dollar against the rupee, with value 0.02 marked.A straight line supply curve, S, slopes up from the bottom left corner to the top right corner.A straight line demand curve, D, slopes down from the top left corner to the bottom right corner.Curves S and D intersect at point with a y-axis value of 0.02, which is connected to the corresponding y-axis value with a dotted line.
-Refer to Figure 15.8.At what level should the Indian government peg its currency to the Canadian dollar to make Canadian imports cheaper in India?
A) greater than $.02/rupee
B) less than $.02/rupee
C) equal to $.02/rupee
D) 1 rupee per dollar
E) greater than 0.02 rupees/dollar
Correct Answer:

Verified
Correct Answer:
Verified
Q1: If the exchange rate between the Canadian
Q5: Thailand's experience with pegging the baht to
Q6: If currencies around the world are based
Q7: According to the theory of purchasing power
Q8: If a country's currency is "pegged" to
Q9: The "Big Mac Theory of Exchange Rates"
Q10: Foreign portfolio investment in Canada has continually
Q11: Figure 15.8 <img src="https://d2lvgg3v3hfg70.cloudfront.net/TB3061/.jpg" alt="Figure 15.8
Q158: The gold standard is an example of<br>A)a
Q198: Explain why international capital markets have expanded