Multiple Choice
Consider the data that generate this plot covering time months 1 to 50.What characteristic is most prominent in the pattern? 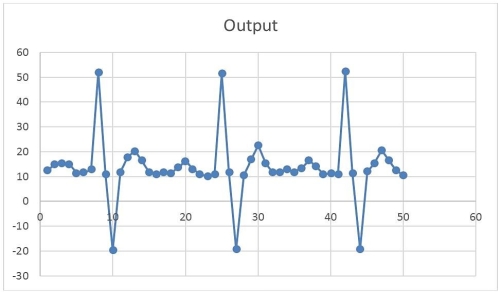
A) trend
B) seasonality
C) randomness
D) none
Correct Answer:

Verified
Correct Answer:
Verified
Related Questions
Q13: The independent variable is the quantity the
Q21: Which of these quantitative techniques is a
Q22: Over the long run,fluctuations in demand due
Q23: A qualitative forecasting technique in which individuals
Q24: A counseling service records the number of
Q27: The greater the randomness in the model,the
Q30: A company keeps track of unit sales
Q34: Nora Damus reviews her forecasting triumphs and
Q68: In order to indicate _ in a
Q72: What is a collaborative planning, forecasting, and