Essay
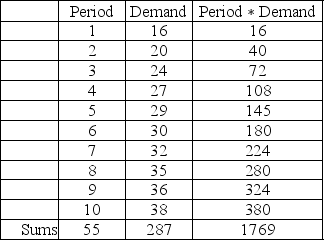
Using the data shown in the table,develop a regression line that can be used to predict the demand for time period number 20.What is the prediction equation and what is your forecast for period 20?
Correct Answer:

Verified
 = = = 2.3 = - = 28.7 -...
View Answer
Unlock this answer now
Get Access to more Verified Answers free of charge
Correct Answer:
Verified
View Answer
Unlock this answer now
Get Access to more Verified Answers free of charge
Q10: The greater the randomness in the data,
Q32: Demand was low two years ago but
Q39: A model with a positive mean forecast
Q54: A counseling service records the number of
Q58: A poultry farmer that dabbles in statistics
Q60: Which one of the following statements regarding
Q61: A qualitative forecasting technique well-suited for demand
Q62: A drive-in restaurant has experienced the following
Q65: _ is unpredictable movement from one time
Q66: What distinguishes collaborative planning, forecasting, and replenishment