Essay
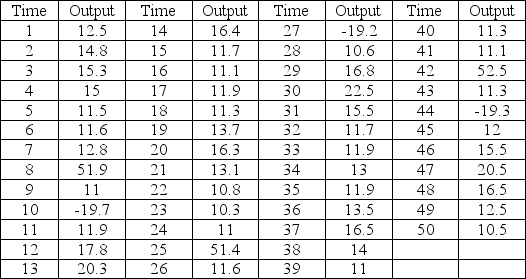
Using the data in the table,first plot the data and comment on the appearance of the demand pattern.Then develop a forecast for periods 51-70 that fits the data.
Correct Answer:

Verified
Data are highly seasonal as the graph an...View Answer
Unlock this answer now
Get Access to more Verified Answers free of charge
Correct Answer:
Verified
View Answer
Unlock this answer now
Get Access to more Verified Answers free of charge
Q25: Multiple regression is used when the forecaster
Q30: A company keeps track of unit sales
Q33: Describe the mechanics of three qualitative forecasting
Q34: A poultry farmer that dabbles in statistics
Q37: A counseling service records the number of
Q38: A poultry farmer that dabbles in statistics
Q40: When there is a significant upward or
Q47: The panel consensus forecasting approach requires that
Q49: Two smoothing models that yield identical forecasts
Q79: Exponential smoothing with an alpha of one