Multiple Choice
This graph of expected sales level and expected output shows: 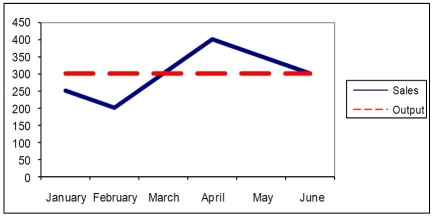
A) a chase production plan is being used.
B) a level production plan is being used.
C) a mixed production plan is being used.
D) planning levels have been computed.
Correct Answer:

Verified
Correct Answer:
Verified
Related Questions
Q1: As potato harvest season approaches, the number
Q5: What are the possibilities for matching capacity
Q21: A hotel using yield management would _
Q22: A company has a sales forecast for
Q25: A major retailer has recently deployed self-checkout
Q27: Create a minimum cost chase plan for
Q44: How can and why should a firm
Q48: Last month, the sales and operations plan
Q61: Forty percent of a house painter's business
Q75: The Super Bowl is right around the