Multiple Choice
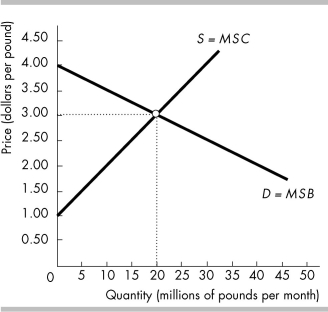
-The figure above shows the market for coffee. When the efficient quantity of coffee is produced, the marginal social benefit from the last pound is
A) $1.00.
B) $2.50.
C) $3.00.
D) $4.00.
Correct Answer:

Verified
Correct Answer:
Verified
Q65: Deadweight loss can be the result of<br>A)
Q66: Alvin Roth of Harvard won the 2012
Q67: <img src="https://d2lvgg3v3hfg70.cloudfront.net/TB8586/.jpg" alt=" -The figure illustrates
Q68: Why does the problem of the big
Q69: The producer surplus on a unit of
Q71: If the market for diamonds is a
Q72: <img src="https://d2lvgg3v3hfg70.cloudfront.net/TB8586/.jpg" alt=" -The figure above
Q73: If the government subsidizes the production of
Q74: <img src="https://d2lvgg3v3hfg70.cloudfront.net/TB8586/.jpg" alt=" The figure shows
Q75: <img src="https://d2lvgg3v3hfg70.cloudfront.net/TB8586/.jpg" alt=" -The figure above