Multiple Choice
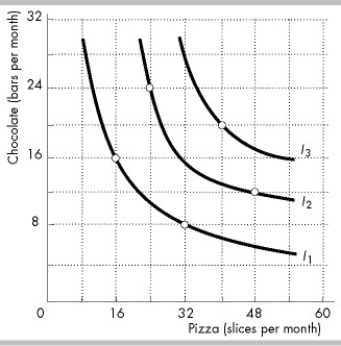
-The indifference curves in the figure above (I1, I2, and I3) reflect Peter's consumption preferences. Peter prefers consuming ________ to consuming ________.
A) 48 slices of pizza and 12 chocolate bars; 24 slices of pizza and 24 chocolate bars
B) 40 slices of pizza and 20 chocolate bars; 48 slices of pizza and 12 chocolate bars
C) 24 slices of pizza and 24 chocolate bars; 40 slices of pizza and 20 chocolate bars
D) 32 slices of pizza and 8 chocolate bars; 16 slices of pizza and 16 chocolate bars
Correct Answer:

Verified
Correct Answer:
Verified
Q47: <img src="https://d2lvgg3v3hfg70.cloudfront.net/TB5274/.jpg" alt=" -To draw your
Q48: The marginal rate of substitution is equal
Q49: <img src="https://d2lvgg3v3hfg70.cloudfront.net/TB5274/.jpg" alt=" -Julie's demand curve
Q50: All points below a given indifference curve
Q51: Which of the following factors is NOT
Q53: <img src="https://d2lvgg3v3hfg70.cloudfront.net/TB5274/.jpg" alt=" -Joe spends $72
Q54: If the price of peanuts increases by
Q55: Explain how changes in the price of
Q56: During October and November 2008, gasoline prices
Q57: <img src="https://d2lvgg3v3hfg70.cloudfront.net/TB5274/.jpg" alt=" -In the table