Multiple Choice

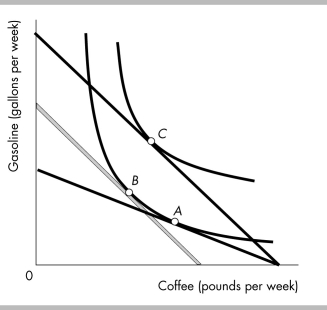
-The substitution effect from a fall in the price of a gallon of gasoline is shown in the above figure by the movement from
A) point A to point C.
B) point A to point B.
C) point B to point C.
D) point A to point B and then to point C.
Correct Answer:

Verified
Correct Answer:
Verified
Q192: When a consumer is consuming at a
Q193: The magnitude of the slope of the
Q194: <img src="https://d2lvgg3v3hfg70.cloudfront.net/TB5274/.jpg" alt=" -In the figure
Q195: <img src="https://d2lvgg3v3hfg70.cloudfront.net/TB5274/.jpg" alt=" -In the figure
Q196: During October and November 2008, gasoline prices
Q198: If you considered steak and lobster to
Q199: <img src="https://d2lvgg3v3hfg70.cloudfront.net/TB5274/.jpg" alt=" -Lizzie's budget line
Q200: Indifference curves are<br>A) bowed in toward the
Q201: The price effect is the effect of
Q202: Real income equals a household's income<br>A) in