Multiple Choice
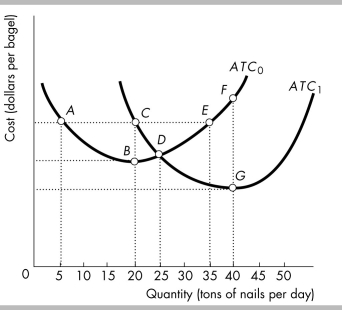
-The average total cost curves for Plant 1, ATC0, and Plant 2, ATC1, are shown in the figure above. The long-run average cost curve goes through points
A) C, D, G.
B) A, C, E.
C) A, B, D, G.
D) A, B, D, E, F.
Correct Answer:

Verified
Correct Answer:
Verified
Q325: What does a firm's short-run total product
Q326: Economies of scale occur when the percentage
Q327: <img src="https://d2lvgg3v3hfg70.cloudfront.net/TB8586/.jpg" alt=" -Based on the
Q328: <img src="https://d2lvgg3v3hfg70.cloudfront.net/TB8586/.jpg" alt=" -In the above
Q329: <img src="https://d2lvgg3v3hfg70.cloudfront.net/TB8586/.jpg" alt=" -The table above
Q331: <img src="https://d2lvgg3v3hfg70.cloudfront.net/TB8586/.jpg" alt=" -Dustin's copy shop
Q332: <img src="https://d2lvgg3v3hfg70.cloudfront.net/TB8586/.jpg" alt=" -The table above
Q333: Diseconomies of scale definitely means that as
Q334: Average product equals the<br>A) increase in output
Q335: <img src="https://d2lvgg3v3hfg70.cloudfront.net/TB8586/.jpg" alt=" -The above table