Multiple Choice
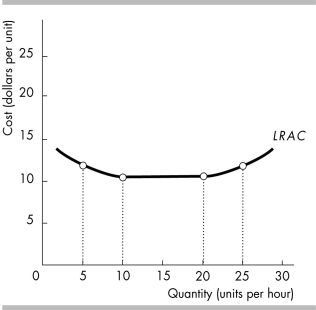
-In the above figure, the long-run average cost curve exhibits economies of scale
A) between 5 and 10 units per hour.
B) between 10 and 20 units per hour.
C) between 20 and 25 units per hour.
D) along the entire curve.
Correct Answer:

Verified
Correct Answer:
Verified
Q80: <img src="https://d2lvgg3v3hfg70.cloudfront.net/TB8586/.jpg" alt=" -In the above
Q81: <img src="https://d2lvgg3v3hfg70.cloudfront.net/TB8586/.jpg" alt="
Q82: Average variable cost is at a minimum
Q83: When the marginal product of labor exceeds
Q84: The marginal product of labor is the<br>A)
Q86: The law of diminishing returns occurs because<br>A)
Q87: <img src="https://d2lvgg3v3hfg70.cloudfront.net/TB8586/.jpg" alt=" -The table above
Q88: The vertical distance between a firm's total
Q89: <img src="https://d2lvgg3v3hfg70.cloudfront.net/TB8586/.jpg" alt=" -In the above
Q90: "Diseconomies of scale" occur in<br>A) the long