Multiple Choice
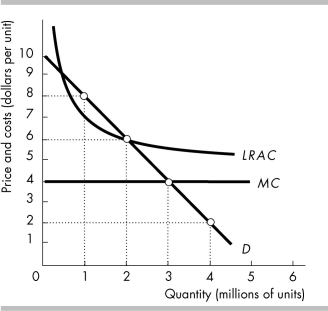
-The figure above shows the costs and demand curves for the Bigshow Cable Company. To avoid any deadweight loss in the market served by Bigshow, the regulator must set the price at
A) $8.
B) $6.
C) $4.
D) $2.
Correct Answer:

Verified
Correct Answer:
Verified
Q538: <img src="https://d2lvgg3v3hfg70.cloudfront.net/TB8586/.jpg" alt=" -If the monopoly
Q539: <img src="https://d2lvgg3v3hfg70.cloudfront.net/TB8586/.jpg" alt=" -In the above
Q540: Explain the difference between price cap regulation
Q541: Describe the main problem with rate of
Q542: <img src="https://d2lvgg3v3hfg70.cloudfront.net/TB8586/.jpg" alt=" -In the figure
Q544: Which produces more output: a perfectly price
Q545: Which of the following is TRUE for
Q546: In July 2008, the Federal Communications Commission
Q547: A perfect price discriminator<br>A) charges the maximum
Q548: The value of resources devoted to rent