Multiple Choice
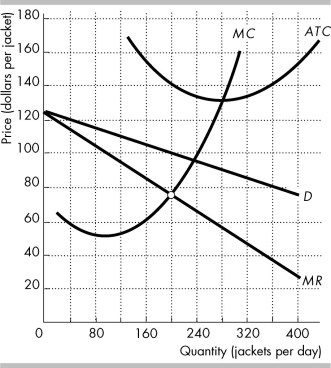 The figure shows the demand curve for Gap jackets (D) , and Gap's marginal revenue curve (MR) , marginal cost curve (MC) , and average total cost curve (ATC) .
-In the figure above, Gap maximizes its profit if it sells ________ jackets per day.
A) 200
B) 240
C) 275
D) 140
Correct Answer:

Verified
Correct Answer:
Verified
Q177: If a firm spends $600 more on
Q178: Suppose that at one of the Talbot's
Q179: In monopolistic competition, firms compete on product
Q180: Shower Power, Inc., a firm in monopolistic
Q181: A monopolistically competitive firm in the long
Q183: If firms monopolistically competitive firms are making
Q184: How do product development and marketing affect
Q185: <img src="https://d2lvgg3v3hfg70.cloudfront.net/TB8586/.jpg" alt=" -The above figure
Q186: Which of the following is TRUE regarding
Q187: The Firefox, Safari, and Opera browsers are