Essay
A common application of Monte Carlo simulation is to provide numerical approximations. One such application is to approximate the area under a curve, or Monte Carlo integration. The following figure represents such a curve, defined over the range of X = 0 to X = 13. Call the area under this curve a.Monte Carlo integration begins by overlaying on the curve of interest a region (call this region, B) whose area is easy to calculate (i.e., a box). Monte Carlo integration then involves the random generation of points in B and a determination of the percentage of these points that fall in A (i.e., fall below the curve). This percentage represents that portion of the area of B that is the area of a.Use Monte Carlo integration techniques to approximate the area under the curve. Use exact techniques to calculate the true area under the curve. How accurate is your approximation? 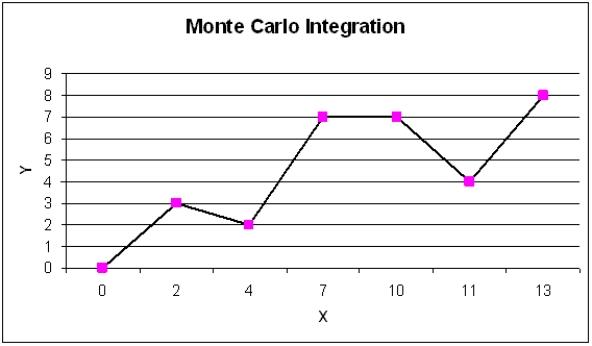
Correct Answer:

Verified
There are 6 line segments in the curve. ...View Answer
Unlock this answer now
Get Access to more Verified Answers free of charge
Correct Answer:
Verified
View Answer
Unlock this answer now
Get Access to more Verified Answers free of charge
Q11: <br>An auto parts store wants to simulate
Q12: A machine produces an average of 500
Q13: What is the probability that 3 or
Q14: Which Risk Solver Platform (RSP) function will
Q19: What function should be used for
Q20: Which Risk Solver Platform (RSP) function will
Q43: What is a weakness of manual what-if
Q50: A simulation model was replicated 100 times
Q75: Exhibit 12.3<br>The following questions use the information
Q77: Exhibit 12.2<br>The following questions use the information