Short Answer
Exhibit 13.4
The following questions refer to the information and output below.
A grocery store can serve an average of 360 customers per hour. The service times are exponentially distributed. The store has 4 checkout lines each of which serves 90 customers per hour. Customers arrive at the store at a Poisson rate of 240 customers per hour. The following queuing analysis spreadsheet was developed from this information. 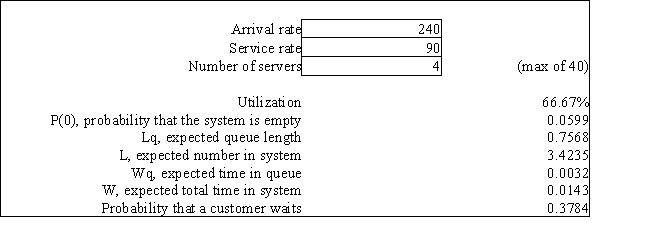
-Refer to Exhibit 13.4. Based on this report how long does a customer wait before the checker begins serving them?
Correct Answer:

Verified
Correct Answer:
Verified
Q76: Exhibit 13.1<br>The following questions are based on
Q77: Exhibit 12.5<br>The following questions use the information
Q78: Exhibit 13.3<br>The following questions refer to the
Q79: What is the mean arrival rate based
Q80: Exhibit 12.5<br>The following questions use the information
Q82: Exhibit 13.1<br>The following questions are based on
Q83: Exhibit 13.1<br>The following questions are based on
Q84: Exhibit 12.5<br>The following questions use the information
Q85: Exhibit 13.4<br>The following questions refer to the
Q86: Exhibit 13.4<br>The following questions refer to the