Multiple Choice
Figure 4-5 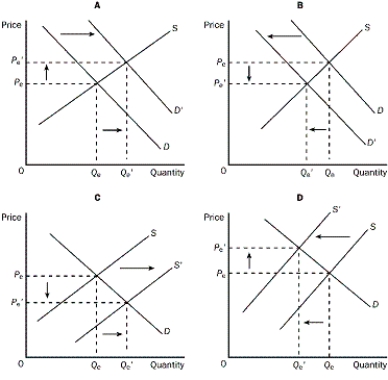
-Refer to Figure 4-5. Which of the four graphs represents the market for peanut butter after a major hurricane hits the peanut-growing area?
A) graph A
B) graph B
C) graph C
D) graph D
Correct Answer:

Verified
Correct Answer:
Verified
Q31: What is an example of complementary goods?<br>A)hamburgers
Q32: What is an example of substitute goods?<br>A)butter
Q33: Kingston is a small college city in
Q34: Market demand is given as Qd =
Q36: Suppose that demand decreases AND supply decreases.
Q37: Table 4-2<br> <img src="https://d2lvgg3v3hfg70.cloudfront.net/TB4795/.jpg" alt="Table 4-2
Q39: Figure 4-1 <img src="https://d2lvgg3v3hfg70.cloudfront.net/TB4795/.jpg" alt="Figure 4-1
Q40: Figure 4-3 <img src="https://d2lvgg3v3hfg70.cloudfront.net/TB4795/.jpg" alt="Figure 4-3
Q97: When an increase in the price of
Q166: For teens,what does a 10 percent increase