Multiple Choice
Figure 4-5 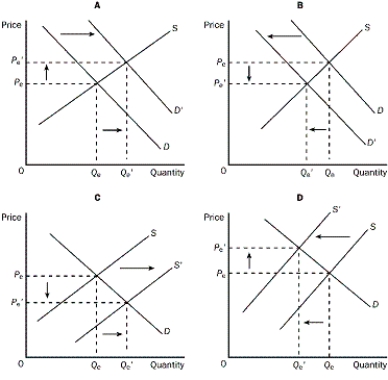
-Refer to Figure 4-5. Which of the four graphs represents the market for cars after new technology was installed on assembly lines?
A) graph A
B) graph B
C) graph C
D) graph D
Correct Answer:

Verified
Correct Answer:
Verified
Related Questions
Q6: If Francis receives an increase in his
Q40: Workers at a bicycle assembly plant currently
Q41: In a market, the price of any
Q51: What is an example of an inferior
Q52: What will happen in the rice market
Q53: Market demand is given as Qd =
Q55: Table 4-2<br> <img src="https://d2lvgg3v3hfg70.cloudfront.net/TB4795/.jpg" alt="Table 4-2
Q57: Market demand is given as Qd =
Q101: What happens at the equilibrium price?<br>A) Buyers
Q167: If buyers and/or sellers are price takers,