Multiple Choice
Figure 4-7 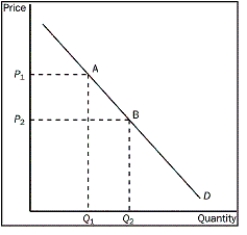
-Refer to Figure 4-7. What does the movement from point A to point B on the graph show?
A) a decrease in demand
B) an increase in demand
C) a decrease in quantity demanded
D) an increase in quantity demanded
Correct Answer:

Verified
Correct Answer:
Verified
Related Questions
Q81: What could be one result of a
Q95: What is another term for equilibrium price?<br>A)balancing
Q96: What is the side of the market
Q97: You have been asked by your economics
Q98: Market demand is given as Qd =
Q101: Figure 4-4 <img src="https://d2lvgg3v3hfg70.cloudfront.net/TB4795/.jpg" alt="Figure 4-4
Q102: Beef is a normal good. You observe
Q103: What can be said about economists in
Q122: What might be the reason when quantity
Q219: What does a market demand curve reflect?<br>A)