Multiple Choice
Figure 8-1 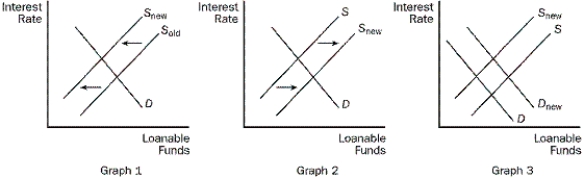
-Refer to Figure 8-1. Which of the graphs in the figure shows the effects of an increase in the tax rate on saving?
A) graph 1
B) graph 2
C) graph 3
D) none of the three graphs
Correct Answer:

Verified
Correct Answer:
Verified
Related Questions
Q9: Which of the following is both a
Q9: What are the basic differences between bonds
Q53: What does the slope of the supply
Q71: Which of the following equations will always
Q199: The country of Meritor uses the merit
Q202: Assuming that other things remain the same,
Q205: The following table shows information about bonds
Q206: Which of the following is the primary
Q207: Table 8-2.<br> <img src="https://d2lvgg3v3hfg70.cloudfront.net/TB4795/.jpg" alt="Table 8-2.
Q208: Which of the following would most likely