Multiple Choice
Figure 8-1 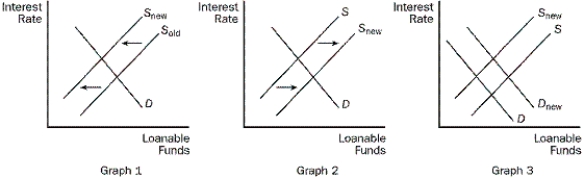
-Refer to Figure 8-1. Which of the graphs in the figure shows the effects of instituting a national sales tax and simultaneously lowering the income tax rate?
A) graph 1
B) graph 2
C) graph 3
D) none of the three graphs
Correct Answer:

Verified
Correct Answer:
Verified
Related Questions
Q56: What does a higher interest rate induce
Q69: When the government runs a budget deficit,
Q106: What is the effect of an increase
Q150: Which of the following would NOT result
Q156: If the nominal interest rate is 6
Q157: Stock in Synergistic Corporation is selling at
Q158: In examining the national income accounts of
Q160: If people become less optimistic about the
Q209: If Huedepool Beer runs into financial difficulty,
Q212: Joan uses some of her income to