Multiple Choice
Figure 16-3 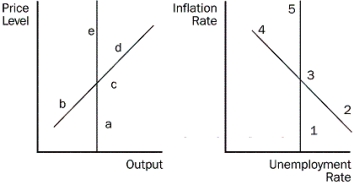
-Refer to Figure 16-3. Where does an increase in aggregate demand move the economy from c and 3 to, in the short run and the long run?
A) a and 1 in the short run, b and 2 in the long run
B) b and 2 in the short run, a and 1 in the long run
C) d and 4 in the short run, e and 5 in the long run
D) d and 2 in the short run, a and 5 in the long run
Correct Answer:

Verified
Correct Answer:
Verified
Q24: The analysis of Friedman and Phelps argues
Q57: If policymakers reduce aggregate demand, what happens
Q117: Proponents of rational expectations argue that failing
Q139: The long-run response to a decrease in
Q142: A vertical long-run Phillips curve is consistent
Q143: In the short run, policy that changes
Q148: Figure 16-1 <img src="https://d2lvgg3v3hfg70.cloudfront.net/TB4795/.jpg" alt="Figure 16-1
Q150: Figure 16-4 <img src="https://d2lvgg3v3hfg70.cloudfront.net/TB4795/.jpg" alt="Figure 16-4
Q151: Figure 16-4 <img src="https://d2lvgg3v3hfg70.cloudfront.net/TB4795/.jpg" alt="Figure 16-4
Q152: Figure 16-4 <img src="https://d2lvgg3v3hfg70.cloudfront.net/TB4795/.jpg" alt="Figure 16-4