Multiple Choice
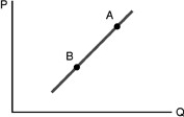
-Refer to the above figure. Moving from point A to point B indicates
A) An increase in supply.
B) An increase in quantity supplied.
C) A decrease in supply.
D) A decrease in quantity supplied.
Correct Answer:

Verified
Correct Answer:
Verified
Related Questions
Q40: A supply curve<br>A) has an indirect or
Q59: A schedule of amounts of a good
Q145: The price of a new textbook is
Q170: Briefly discuss the determinants of demand other
Q211: A market demand schedule for a product
Q216: Which of the following is a determinant
Q236: A demand curve is derived from<br>A) the
Q337: <img src="https://d2lvgg3v3hfg70.cloudfront.net/TB5016/.jpg" alt=" -In the above
Q404: Which of the following statements is FALSE
Q435: Graphically, the market supply curve is obtained