Multiple Choice
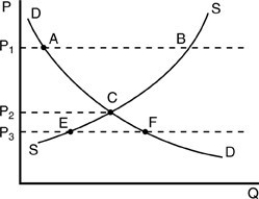
-According to the above figure, a shortage is shown between which two points?
A) A and E
B) C and B
C) A and B
D) E and F
Correct Answer:

Verified
Correct Answer:
Verified
Related Questions
Q336: Which of the following will cause the
Q337: In the long run, the number of
Q338: Which of the following is a determinant
Q339: Which one of the following statements is
Q340: If the price of gasoline rises sharply
Q342: With reference to the difference between a
Q343: A shift in the demand curve will
Q344: In order to increase the supply of
Q345: The law of demand includes the statement
Q346: Market demand is<br>A) the total quantities demanded