Multiple Choice
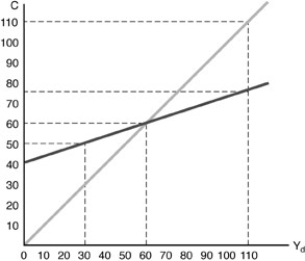
-Consider the above figure. The equation for the consumption function is
A) C = 40 + 60  .
.
B) C = 40 + 50  .
.
C) C = 40 + 0.33  .
.
D) C = 40 + 0.1  .
.
Correct Answer:

Verified
Correct Answer:
Verified
Q12: Suppose autonomous consumption decreases. This reduction in
Q14: Saving differs from savings in that<br>A) saving
Q16: Along a linear consumption function,<br>A)the average propensity
Q63: <img src="https://d2lvgg3v3hfg70.cloudfront.net/TB5018/.jpg" alt=" -Refer to the
Q72: Other things being constant, if the marginal
Q106: When graphing the consumption function, what purpose
Q112: Saving is an example of<br>A)a flow concept.<br>B)a
Q204: If the marginal propensity to save is
Q226: The terms "saving" and "savings" differ in
Q293: <img src="https://d2lvgg3v3hfg70.cloudfront.net/TB5018/.jpg" alt=" -In the above