Multiple Choice
Which of the following statements with respect to the figure below is INCORRECT? 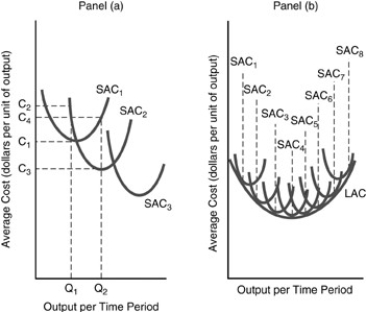
A) All the possible short-run average cost curves that correspond to the different plant sizes are shown as  -
-  .
.
B) If the anticipated permanent rate of output per unit time period is  in panel (a) , the optimal plant would correspond to
  .
.
C) If the permanent rate of output increases to  in panel (a) , it will be more profitable to have a plant size corresponding to
  .
.
D) The long-run average cost curve LAC in panel (b) is sometimes called the planning curve representing the locus (path) of points.
Correct Answer:

Verified
Correct Answer:
Verified
Q85: When increasing its output results in falling
Q150: "The long-run average cost curve is derived
Q161: At Phil's Hot Dog Stand, we found
Q163: Which of the following is NOT a
Q168: <img src="https://d2lvgg3v3hfg70.cloudfront.net/TB5013/.jpg" alt=" -Refer to the
Q175: What is the most important determinant of
Q179: The lowest rate of output per unit
Q190: <img src="https://d2lvgg3v3hfg70.cloudfront.net/TB5018/.jpg" alt=" -Refer to the
Q224: The marginal cost curve always intersects the
Q380: <img src="https://d2lvgg3v3hfg70.cloudfront.net/TB5018/.jpg" alt=" -Refer to the