Multiple Choice
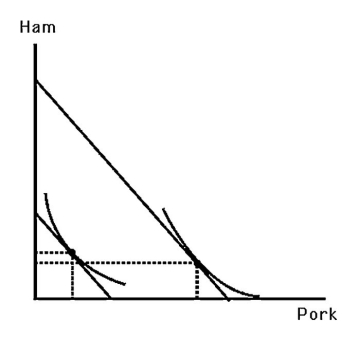
-The above figure shows Larry's indifference map and budget lines for ham and pork.Which of the following statements is TRUE?
A) Larry's demand curve for pork shifts rightward when his income increases.
B) Larry's income elasticity of demand for pork is greater than zero.
C) Pork is a normal good.
D) All of the above.
Correct Answer:

Verified
Correct Answer:
Verified
Q54: Suppose Lisa spends all of her money
Q55: <img src="https://d2lvgg3v3hfg70.cloudfront.net/TB6808/.jpg" alt=" -The above figure
Q56: A good may be inferior at some
Q57: Newspaper accounts of the U.S.labor market often
Q58: <img src="https://d2lvgg3v3hfg70.cloudfront.net/TB6808/.jpg" alt=" -The above figure
Q60: What is the benefit of understanding the
Q61: <img src="https://d2lvgg3v3hfg70.cloudfront.net/TB6808/.jpg" alt=" -The above figure
Q62: Consider two lottery winners,Tino who is 65
Q63: A demand curve for a Giffen good
Q64: The price of leisure<br>A) is the same