Multiple Choice
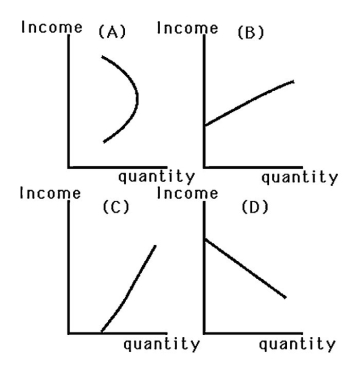
-When John's income was low,he could not afford to dine out and would respond to a pay raise by purchasing more frozen dinners.Now that his income is high,a pay raise causes him to dine out more often and buy fewer frozen dinners.Which graph in the above figure best represents John's Engel curve for dining out?
A) Graph A
B) Graph B
C) Graph C
D) Graph D
Correct Answer:

Verified
Correct Answer:
Verified
Q1: The Fisher index<br>A) uses the arithmetic mean
Q3: If the Engel curve for a good
Q4: Suppose that the interest rate paid to
Q5: A tax cut that raises the after-tax
Q6: If workers are in the backward-bending section
Q7: Sandy derives utility from consuming "all other
Q8: For an inferior good,if the income effect
Q9: Suppose a person's utility for leisure (L)and
Q10: The Affordable Care Act is intended to
Q11: When income increases by 1%,the quantity demanded