Multiple Choice
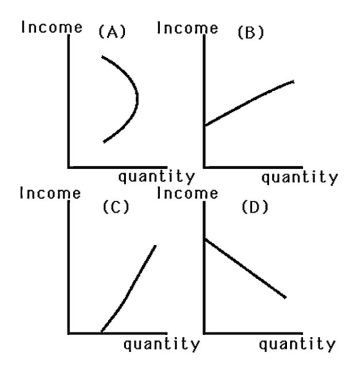
-When John was in college and his income was low,he drank "Red Ribbon" beer.As his income increased,he purchased better-quality beer and less "Red Ribbon." Which graph in the above figure best represents John's Engel curve for "Red Ribbon" beer?
A) Graph A
B) Graph B
C) Graph C
D) Graph D
Correct Answer:

Verified
Correct Answer:
Verified
Q90: Many manufacturers sell products labeled as having
Q91: <img src="https://d2lvgg3v3hfg70.cloudfront.net/TB6808/.jpg" alt=" -The above figure
Q92: Suppose a graph is drawn to show
Q93: Suppose that the interest rate paid to
Q94: Employing a fixed-weight index like the Consumer
Q96: Ten individuals have $100 and identical preferences
Q97: Explain what the slope of the income
Q98: A percentage increase in the overall price
Q99: Using a Paasche index to calculate the
Q100: Both Sally and Sam receive a 10%