Multiple Choice
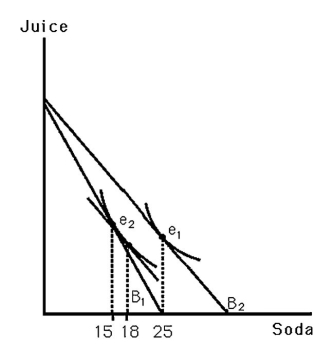
-The above figure shows Bobby's indifference map for soda and juice.B1 indicates his original budget line.B2 indicates his budget line resulting from an increase in the price of soda.From the graph,one can conclude that
A) Bobby views soda as an inferior good.
B) Bobby's demand for soda is perfectly inelastic.
C) Bobby views soda as a normal good.
D) the income elasticity of demand for soda is 1.
Correct Answer:

Verified
Correct Answer:
Verified
Q39: Under which of the following conditions will
Q40: If a person supplies fewer hours of
Q41: Suppose a person's utility for leisure (L)and
Q42: One characteristic of a Giffen good is
Q43: <img src="https://d2lvgg3v3hfg70.cloudfront.net/TB6808/.jpg" alt=" -The above figure
Q45: If a good is considered a normal
Q46: Suppose the quantity of x is measured
Q47: Suppose the quantity of x is measured
Q48: An increase in unearned income always creates
Q49: Before an uneven rise in prices Allan