Multiple Choice
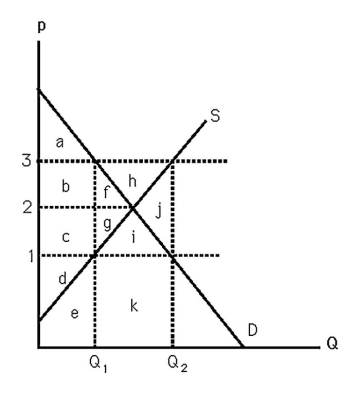
-The above figure shows supply and demand curves for milk.If the government passes a $2 per gallon specific tax,the tax revenue is
A) $2 ∗ Q1.
B) $2 ∗ Q2.
C) $2 ∗ (Q2 - Q1) .
D) $2.
Correct Answer:

Verified
Correct Answer:
Verified
Related Questions
Q4: Which of the following characterizes long-run equilibrium
Q5: Sally is shopping for textbooks at the
Q6: Suppose the market supply curve is p
Q7: Without restrictions,the market supply curve is horizontal
Q8: In the long run,firms in a competitive
Q10: You enter a store and buy a
Q11: <img src="https://d2lvgg3v3hfg70.cloudfront.net/TB6808/.jpg" alt=" -The above figure
Q12: In a competitive market,the demand and supply
Q13: Measuring society's welfare as 2*CS + 0.5*PS<br>A)
Q14: Sarah's demand curve for shoes has the