Multiple Choice
Graph 10-2 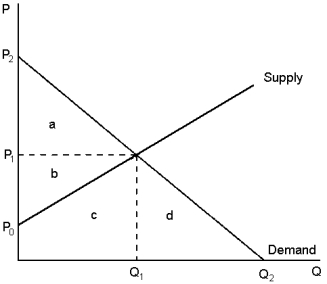 This graph depicts the market for pork.Use this information to answer the following question(s) .
-In Graph 10-2, producer and consumer surplus at the point of market efficiency is represented by area(s) :
A) a + b
B) a + d
C) b + c
D) c + d
Correct Answer:

Verified
Correct Answer:
Verified
Q44: If the consumption of bananas is at
Q45: When a producer operates in a market
Q46: Graph 10-5 <img src="https://d2lvgg3v3hfg70.cloudfront.net/TB8859/.jpg" alt="Graph 10-5
Q47: Private contracts between parties with mutual interests:<br>A)can
Q48: Contracts cannot solve the inefficiency that arises
Q50: Firms that can reduce pollution easily will
Q51: To ensure the market reaches the social
Q52: When developing a new technology for operating
Q53: In which of the following situations may
Q54: A positive externality exists when:<br>A)a person engages