Multiple Choice
Graph 10-3
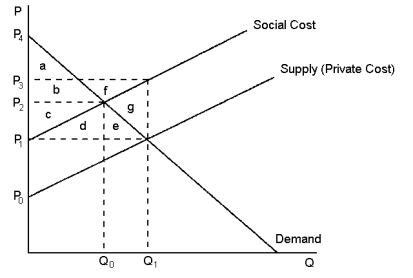 This graph reflects the market for kiwifruit, where pesticide used by kiwifruit orchardists also unintentionally kills honey bees.
-Refer to Graph 10-3. The total surplus derived from the most efficient kiwifruit production levels is represented by the area:
A) g
B) e + g
C) c + d
D) a + b + c
Correct Answer:

Verified
Correct Answer:
Verified
Q5: Which of the following are true of
Q9: In order for regulation to be efficient,
Q30: A local cafe that allowed patrons to
Q31: Private markets fail to reach a socially
Q103: Which of the following suggests that the
Q104: Government can solve externality problems that are
Q106: Which of the following statements is most
Q115: The distribution of rights among parties affected
Q130: Japanese fishermen use gill nets to catch
Q167: One advantage of allowing a market for