Multiple Choice
Graph 13-2
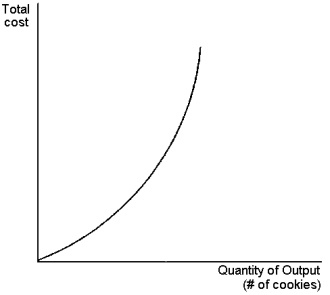 This graph depicts a total cost function for a firm that produces cookies. Use the graph to answer the following question(s) .
-Refer to Graph 13-2. Identify the true statements from the list below. (i) diminishing marginal product for all levels of input usage
(ii) total output increases but at a decreasing rate
(iii) the slope of the production function increases as quantity of inputs increase.
A) (i) only
B) (ii) and (iii)
C) (i) and (iii)
D) (i) , (ii) and (iii)
Correct Answer:

Verified
Correct Answer:
Verified
Q25: The average total cost curve is increasing
Q33: The marginal product of labour can
Q42: Diseconomies of scale occur when:<br>A)long-run average total
Q44: Complete the following formulae:<br>TVC = costs<br>TC =
Q51: Table 13-2<br>Adrienne's Premium Boxing Service subcontracts with
Q51: Total revenue equals:<br>A)total output multiplied by the
Q59: Fill in the following table's missing values.<br>
Q94: Bob Edwards owns Bob's Bagels.He hires an
Q117: Economists normally assume that a firm would?<br>(i)
Q144: Diminishing marginal product suggests that:<br>A)marginal cost is